We are pleased to announce an exciting new alliance between Active Living Research and GP RED to co-host and coordinate...
Cost-effectiveness of Bicycle Infrastructure and Promotion to Increase Physical Activity - The Example of Portland

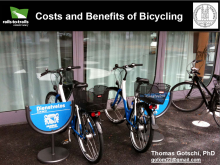
Presentation at the 2010 Active Living Research Annual Conference
Background:
Increasing levels of walking and bicycling has great potential to increase overall levels of physical activity among Americans. Rails-to-Trails Conservancy calculated that under a modest and a substantial scenario walking and bicycling would provide sufficient (30 min. per person and day) physical activity for 50 to 90 million Americans, respectively. However, a lack of national data and research precludes us from predicting the effect of investments in infrastructure and programs on levels of walking and bicycling, the effectiveness of investments, and ultimately the costs for increasing these modes of transportation remain unknown.
Objectives:
The objective of this study is to assess how cost-effectively Portland’s investments in bicycling improve public health by increasing physical activity.
Methods:
We compare costs of infrastructure and the Portland’s SmartTrips program to two types of monetized health benefits, namely health care cost savings and value of life savings. Calculations are conducted over a fifty year period starting in 1991 through 2040.
Costs:
In 2008 the city of Portland estimated the cost of its 300 mile bikeway network at $57 million. In 2003, the city also initiated a promotional program that encouraged bicycling, walking, and use of public transportation, at an estimated cumulative cost through 2012 of $7.2 million. Future plans for Portland’s bicycle master plan foresee an investment of additional $100 million through 2030.
Levels of bicycling:
Since 1991, Portland has counted cyclists crossing bridges across the Willamette River on an annual basis. From 1991 through 2008 the number increased fivefold at an exponential rate of 9.6% per year (R2=0.96). From 2006 to 2007 and from 2007 to 2008 growth was 22% and 14%, respectively.
To extrapolate levels of bicycling for the future we assume a long term goal for 2030 which replicates the fivefold increase Portland achieved between 1991 and 2008. This increase is equivalent to raising the bicycling mode share from currently 4.5% (American Community Survey 2007) to 20% by 2030, less ambitious than the city’s stated goal of 25%. The projected pattern is comparable to several European cities which saw similar growth trends since the late seventies and currently have bike mode shares of over 20%. The 2030 goal assumes that on average one out of five Portlanders will ride their bike 15 minutes a day.
To convert numbers of cyclists to miles cycled we fit a polynomial function to the 1991-2008 cyclist numbers and the 2030 long term goal, and apply it to the number of miles bicycled in 2005 as modeled by Portland’s metropolitan traffic model.
Health benefits:
We assume health care savings from sufficient physical activity at $300 per person and year, based on three studies (Colditz 1987, Pratt 200, Wang 2004). We assume that on average 15 minutes of biking will allow a currently insufficiently active individual to achieve a sufficient (recommended) physical activity level of 30 minutes (almost) every day. The health benefits are discounted and only count benefits for individuals that would not be sufficiently active without biking. We assume that initially (1991) this is only the case for 10% of all bikers, but as biking becomes more mainstream, this proportion rises to 50% by 2030. The conversion of bike miles into health care cost savings further assumes 2.57% annual inflation and average biking speed of 10mph.
In a second approach we apply the World Health Organization’s HEAT (Health Economic Assessment Tool) for cycling tool, which accounts for the value of lives saved from the physical activity resulting from bicycling. We use a statistical value of life of $5.8 million as suggested by the US Department of Transportation.
Results:
In 2008, Portlanders were riding 25.7 million miles by bike, compared to 5.1 million in 1991. By 2017, health care savings alone will amortize the initial investments of $64 million in bicycling. By 2040 a total of $162 million in investments is predicted to produce $1.05 billion in cumulative health care cost savings. The average annual savings in value of lives saved from bicycling is $105 million, or a total of $5.3 billion over the fifty year period. The return on investment ratio (ROI) for health care cost savings alone is 6.5 to 1. Using statistical value of lives, as is done for the evaluation of highway safety improvement projects would increase the ROI to over 30 to 1.
Conclusions:
This first of its kind cost-benefit analysis for investments in bicycling by a US city shows that relatively modest investments of $162 million in bicycling will produce health care cost savings of over $1 billion by the year 2040. Investments in bicycle infrastructure and promotion should therefore be widely considered as a highly cost-effective measure to increase physical activity among Americans.
STAY UP TO DATE
RECENTLY ADDED TOOLS & RESOURCES
MOVE! A BLOG ABOUT ACTIVE LIVING
The "Active Living Conference" aims to break down research and practice silos and...


