ByChad Spoon
Infographic shows why physical activity is a win-win for students and teachers.
January 28, 2015
0
//
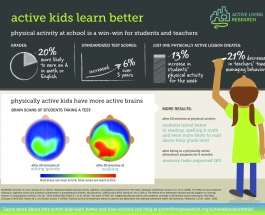
Infographic shows why physical activity is a win-win for students and teachers.

Infographics providing walking & biking to school rates on the regional scale.
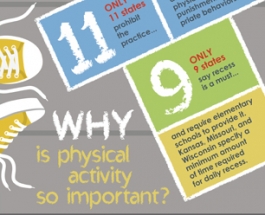
AAHPERD infographic on which states are creating a culture of physical activity in schools.
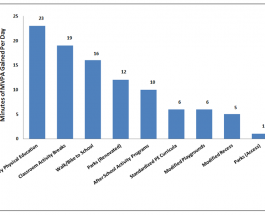
Study estimates the number of minutes in physical activity that different approaches could provide for children.


Promoting activity-friendly communities. Moving research into action.

MOVE!A BLOG ABOUT ACTIVE LIVING
A former ALR grantee gives his perspective on the benefits of using improv comedy to improve collaboration.
...ALR's Jim Sallis is honored for translating research findings from the built environment into action.
...