We are pleased to announce an exciting new alliance between Active Living Research and GP RED to co-host and coordinate...
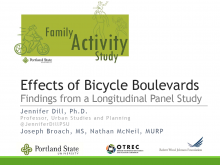
Effects of Bicycle Boulevards: Findings from a Longitudinal Panel Study

Presentation at the 2014 Active Living Research Annual Conference.
Background and Purpose
Research demonstrating the links between the physical environment and walking and bicycling has been reviewed extensively (Owen et al. 2004, Saelens et al. 2003, Ogilvie et al. 2006, Transportation Research Board and Institute of Medicine 2005). Much of the research has focused on adult behavior and few studies explore bicycle-specific infrastructure. Moreover, Pucher, Dill and Handy (2010) found that only a handful of studies were longitudinal, including a control sample. A review of research on environmental correlates of children’s active transportation (Pont et al, 2009) included 38 peer-reviewed articles, though none with longitudinal data.
The role of specific types of bicycle infrastructure in cyclist’s route choice decisions was examined by Broach, Dill, and Gliebe. Using GPS data from adult cyclists, they found a preference for separated paths, followed by bicycle boulevards. Bicycle boulevards are a form of traffic calming on residential streets that give bicycles priority over motor vehicles. This is done through the installation of a combination of traffic calming techniques, such as traffic diverters (which force cars to turn, but bikes and pedestrians can travel through), speed humps, and chicanes and bulb outs (which narrow the street). The boulevards are signed as bicycle routes. When a bicycle boulevard crosses a busy street, traffic signals are sometimes installed to assist cyclists in crossing safely. Stop signs along the street are reversed, so that cross traffic is stopped, rather than the through traffic on the boulevard. Motor vehicle traffic on the streets is much lower than nearby parallel streets, since through traffic is discouraged, and traffic speeds are about the same as bicycles because of the treatments.
Traffic is a major barrier to both adults and children cycling and walking more. In a random phone survey of Portland adults, “too much traffic” was the primary environmental barrier cited by respondents who wanted to bicycle more (Dill and Voros 2007). Of the adults who were not cyclists, but wanted to cycle more, 60% cited traffic as a barrier, while 33% cited the lack of bike lanes/trails, the next highest response; 65% of the adults who only cycled for recreation cited traffic as a barrier. In a national survey, 40% of parents cited traffic danger as a barrier for their children walking and cycling to school, second to long distances (55%) and significantly higher than crime danger (18%) (Dellinger and Staunton 2002).
Objectives
The overall aim of this research was to evaluate the effects of new, innovative infrastructure on physical activity (PA) of families with children. More specifically, the research: 1) Evaluated the effects of new bicycle boulevards (a form of traffic calming) on PA; 2) Examined PA for both recreation and transportation; and 3) Considered other correlates of PA, including socio-demographics, social factors, attitudes, and other physical environment factors, using an ecological model.
Methods
The Family Activity Study is a longitudinal panel study of the effects of bicycle boulevards on bicycling and walking behavior. The study started with 333 families with children living in 19 study sites (nine treatment and ten control) in the City of Portland, OR. This included 495 adults, 325 children ages 5-10, and 176 children ages 11-17. About 80% of the sample completed all phases of the study. Surveys were conducted at three points in time: Pre, Post, and Interim. The Pre and Post surveys are approximately two years apart, with bicycle boulevard construction occurring in between. The Interim surveys were fielded about one year after the Pre surveys, during the phased construction of the projects. The surveys (adults and children) includes personal and household socio-demographics, subjective perceptions of their neighborhood environment, travel attitudes, social norms, self-efficacy towards travel behavior, and self-reported biking and walking behavior. GPS (the GlobalSat DG-100) and accelerometer (the ActiGraph GT3X) data were collected from adults and children for five days during the Pre and Post periods. Data collection was completed July 2013. GPS data are processed to detect mode of transportation (drive, bike, walk, transit, other) and link to the transportation network.
Results
Post data collection was completed one month ago, and data are still being processed and cleaned. During the Pre data collection phase, adults in the control neighborhoods walked an average of 86 minutes and biked an average of 29 minutes over 5-days; adults in the treatment areas walked an average of 97 minutes and biked an average of 37 minutes. These differences were not statistically significant. This conference presentation will focus on an evaluation of Pre vs. Post behavior which will be completed by January 31, 2014.
Conclusions
The presentation will draw conclusions related to the three research objectives, focusing on the intervention's effect on PA, controlling for other factors.
Implications for Practice and Policy
If bicycle boulevards are positively associated with increased PA and active transportation among youth and adults, this may encourage more cities to implement this relatively low-cost infrastructure improvement.
References
- Dellinger, A. M. & C. E. Staunton (2002) Barriers to Children Walking and Biking to School -- United States, 1999. MMWR Weekly, 51, 701-704.
- Dill, J. & K. Voros (2007) Factors Affecting Bicycling Demand: Initial Survey Findings from the Portland, Oregon, Region. Transportation Research Record: Journal of the Transportation Research Board, 2031, pp 9-17.
- John Pucher, Jennifer Dill, and Susan Handy, "Infrastructure, Programs and Policies to Increase Cycling: An International Review," Preventive Medicine, Vol. 50(S1): S106-125, January 2010.
- Joseph Broach, Jennifer Dill, and John Gliebe, “Where Do Cyclists' Ride? A Route Choice Model Developed with Revealed Preference GPS Data,” Transportation Research-Part A. 46: 1730–1740, 2012.
- Ogilvie, D., R. Mitchell, N. Mutrie, M. Petticrew & S. Platt (2006) Evaluating Health Effects of Transport Interventions: Methodologic Case Study. American Journal of Preventive Medicine, 31, 118-126.
- Owen, N., N. Humpel, E. Leslie, A. Bauman & J. F. Sallis (2004) Understanding environmental influences on walking; Review and research agenda. Am J Prev Med, 27, 67-76.
- Pont, K., J. Ziviani, D. Wadley, S. Bennett, and R. Abbott (2009). "Environmental Correlates of Children's Active Transportation: A Systematic Literature Review." Health Place 15: 827-40.
- Saelens, B. E., J. F. Sallis & L. D. Frank (2003) Environmental Correlates of Walking and Cycling: Findings from the Transportation, Urban Design, and Planning Literatures. Annals of Behavioral Medicine, 25, 80-91.
- Transportation Research Board & Institute of Medicine. 2005. Does the built environment influcence physical activity? Examining the Evidence. Washington, DC: National Academy of Sciences.
Support / Funding Source
The Family Activity Study was funded by the Active Living Research program of the Robert Wood Johnson Foundation and the Oregon Transportation Research and Education Consortium (OTREC).
- DOWNLOAD "2014_RethinkingStreetsTrails_Dill.pdf" PDF (5.33 MB) Presentations
Related Tools & Resources
STAY UP TO DATE
RECENTLY ADDED TOOLS & RESOURCES
MOVE! A BLOG ABOUT ACTIVE LIVING
The "Active Living Conference" aims to break down research and practice silos and...


